
If you’ve ever had to export data out of Google Analytics to merge it with other business data or analyze it outside of the Google Analytics interface – you’re not alone. Recently we came across a situation where we had more than 5,000 records that we wanted to download and couldn’t figure out how to do it. We also wanted to find a way to export that data without using the Google Analytics API since we didn’t have an engineer who could help us at the time.
After doing some research we found a solution – to skip to the instructions scroll down to “Solution 2.”
There is a 5,000 row export limit in Google Analytics
You’ve probably changed the toggle below within Google Analytics plenty of times when you want to view more than 10 rows of data. The prompt below is probably very familiar to you since the default is only 10 rows.

Most of the time you won’t need to see more than 100 rows within the Google Analytics interface when you are doing your analysis. However, if you ever need to export all your data from Google Analytics to use for other purposes, you may be frustrated with the 5,000 row limit here.

There are a few ways to get around this issue to export more than 5,000 rows of data out of Google Analytics.
Solution 1
Tap into the Google Analytics API. Since this requires engineering, we’re going to skip this option in order to keep things simple.
Solution 2
Use the Google Analytics plugin for Google Sheets. Note that this does require you to have a gmail or Google account so that you can access Google Sheets.
Here are the steps to implement this:
- Login to your Google account
- Go to this link and install the Google Analytics Add-on for Google Sheets
- Read the documentation and watch the videos on this page
- Once the add-on is installed, open up a Google Sheet and run a report to export your data
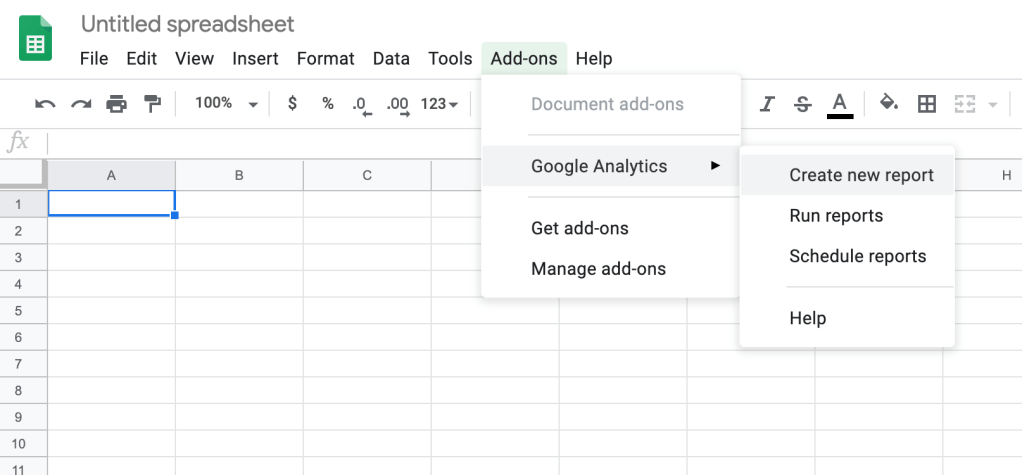
The trickiest part to all of this is locating the new integration within your Google Sheet. See screenshot above to find out where this integration is located. Look for “Add-ons” then let it load and “Google Analytics” will appear. Once you hover on Google Analytics, you can use the tool however you’d like. Create a new report, run an existing report, or even schedule recurring reports.
One of our favorite things to do is to import our Google Analytics data into Google Sheets, then create graphs and charts based on this data that will update automatically when you refresh your report. You can even drop these charts into a Google Slides presentation and refresh them automatically from the same report. This makes regular weekly or monthly reporting very easy and you are able to format it how you want, instead of just using the visualizations that are available to you within the Google Analytics interface.
Export data out of Google Analytics without using the API
Now that you are familiar with the process of integrating the Google Analytics add-on into Google Sheets, you can access the full range of data that Google Analytics collects to pull it out and use it however you’d like. Often times we prefer to work in Excel and will simply export the CSV from Google Sheets, then manipulate the data within Excel.
Here’s an example of how we use this add-on to export our Google Analytics data without using the API. For our e-commerce business, each month we like to compare our Google Analytics data to our internal order data. We do this for a few reasons. First, we want to report on the number of purchases that were actually fulfilled (after order cancellations). Google Analytics won’t retroactively remove data for order cancellations, so we always compare the “Transaction ID” in Google Analytics to the “Order ID” in our shipping system to see which of them actually shipped out and how much revenue we actually collected.
The second reason we like to export this data is also to understand the data discrepancies between our shipping system and Google Analytics. No matter how good your implementation is, there will always be discrepancies between what Google Analytics reports for revenue and transactions and what you actually ship out and revenue you actually collect from the customer. While these data discrepancies are inevitable, it’s still good to have an understanding of how much the discrepancy is. Typically if the numbers in your shipping system and Google Analytics are within 10% of each other, that is considered acceptable, but the lower the rate, the better. Since a lot of your time making marketing optimizations and doing daily checkins on performance are happening within the Google Analytics platform, it’s important to know if Google Analytics is over-reporting or under-reporting your data so that you can consider that while checking your reports within Google Analytics.
The third reason we like to export Google Analytics data is because Google doesn’t collect or store any personally identifiable information within their platform, and only gives you blanket anonymized data to work from. Sometimes it’s helpful to merge the data within Google Analytics with your CRM customer database so you can unlock more insights. For example, if you are able to layer Google Analytics channel attribution data onto customer lifetime value data, then you can make better decisions around which channels are driving the most long-term revenue for you. If you only look at the “last-click” data in Google Analytics, you would only be able to make decisions based on looking at channels that are driving a single first purchase without understanding what happens over the long run.
Keep in mind that in order to merge Google Analytics data with your customer data or shipping data, you will need to have a “key” field that allows you to tie the two relational databases. Often times for Google Analytics this will be the “Transaction ID.”
Read about more tricks and Google Analytics hacks like how to add a third dimension in Google Analytics and how to figure out where your direct traffic is coming from in Google Analytics.
