
In this post we will cover how to add an additional dimension of segmentation within google analytics when you have already filled in a “primary” and “secondary” dimension. To skip to the short answer, scroll down to the solution in bold.
If you are a Google Analytics power user (or even an intermediate user) you are probably using the “Secondary Dimension” breakdown almost on a daily basis.

This toggle above probably looks extremely familiar to you and allows you to narrow down your segments to understand performance. Although this function can be used for countless types of marketing analysis let’s pick one just to elaborate.
Let’s say you are an Email Marketing Manager and the performance of your channel has been slipping over that past few weeks. Naturally you will look at your top of funnel metrics like open and click rate, but if those look good you will need to shift to web performance analysis to understand what’s going on.
Given the example above you would typically start by narrowing your view within Google Analytics to a medium of “email” for instance – which would then be set as your “Primary dimension.”

After that you might add a “Secondary dimension” of “campaign” which would list out all the emails you sent so you can see if the problem is a from a specific set of email campaigns.

Keep in mind this trick can apply to any type of traffic, landing page, or however else you want to break down your data in Google Analytics – this is not just a solution for email.
Now that you have all your campaigns listed out – let’s say you still don’t see anything meaningful that explains why your email traffic conversion is going down. The next place to look might be a device level breakdown to see if the problem is limited to mobile or desktop email traffic.
This is where people usually get stuck
Because there is no way to add a “Third dimension” in Google Analytics in the basic view most users are stuck limiting their analysis to a couple levels of depth. The good news is that there is a super easy and accurate way to add a 3rd dimension to further break down your data. The solution is to create a custom segment for whatever your primary dimension currently is, and this will filter all the traffic in your current view which frees you up to set a new primary dimension and secondary dimension, which will create 3 levels of depth that you can drill into.
Here’s how to do it. First, click add segment right above the graph section in Google Analytics. Once you do that, you will see this screen:
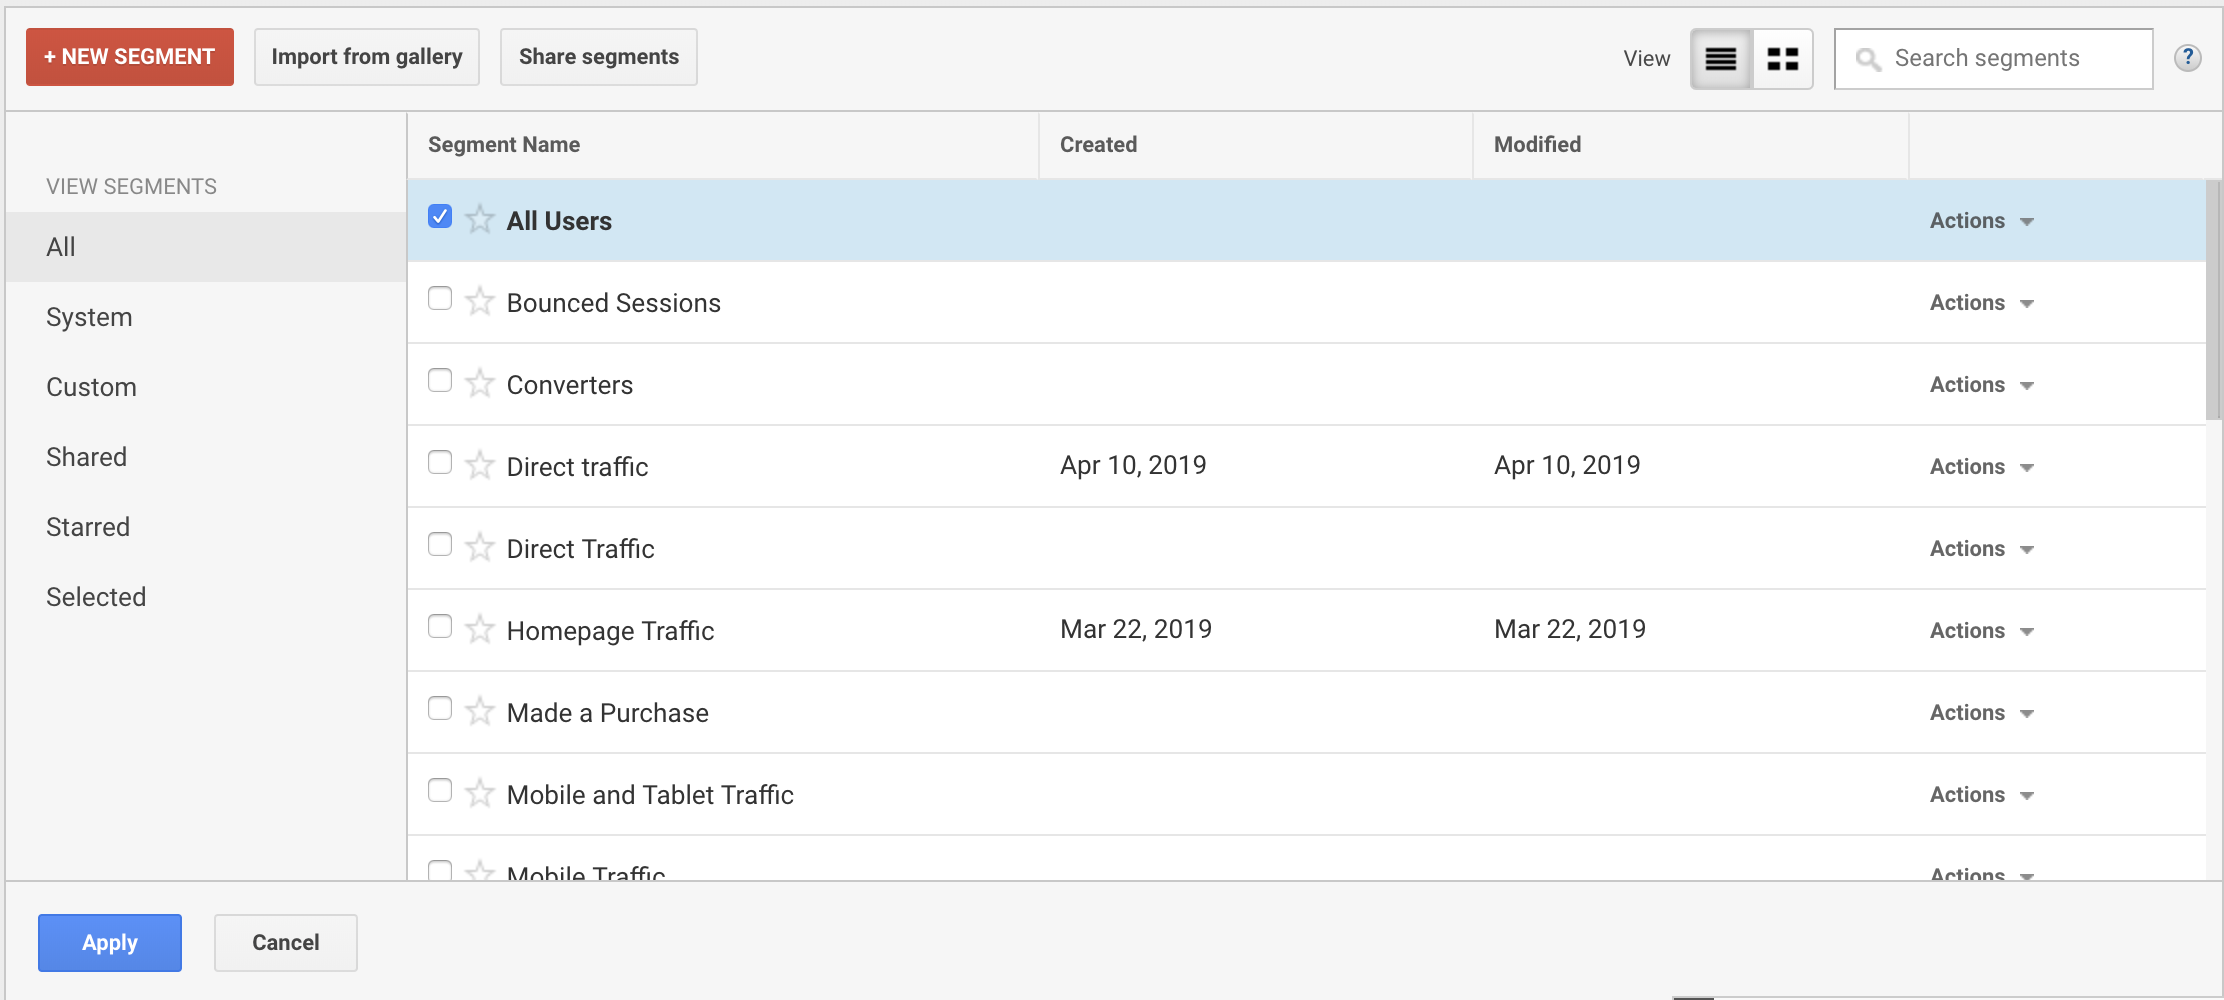
Then you can create your own custom segment or choose from the system standard ones. To keep using our Email Marketing example we are going to create a custom one by clicking “New Segment” in the screen above which yields the options below:

Once you define, save, and select that new segment you can clear out the default “All Users” segment so you are just looking at email traffic which will look like this once that’s all set:

Now all your traffic is filtered to your original primary dimension of medium “email” as we had above. From here, you can look at a list of your campaigns and also add a secondary dimension of device, geography, and tons of other variables to unlock additional visibility.
